

Brewing Quality at Scale: Performance Testing with Playwright and Artillery

Imagine when a barista brews one cup of coffee, the quality is usually perfect with the right temperature, rich aroma and balanced taste but what happens when they have to brew 100 cups during the morning rush? Even with the same beans and machine, the taste might change due to several factors:
- Water temperature may not stay consistent
- Grind quality can fluctuate under pressure
- Baristas may rush steps like tamping or timing
- Machines can overheat or clog
This mirrors what happens in software applications under load:
Coffee Shop
- Great taste in small batches
- Quality drops when rushed
- Machines may break down
- Customers leave unhappy
Software Application
- Fast response with few users
- Latency increases under high traffic
- Server crash or APIs timeout
- Users abandon slow apps
In my previous article, “Blocking Bugs and Building Quality Software with the Test Pyramid” we explored the different layers of functional testing. In this article, I’ll show you how to extend your existing end-to-end (E2E) tests written with Playwright by integrating Artillery to perform performance testing. A key benefit of this approach is that it eliminates the need to write and maintain separate scripts for functional and performance testing.
Setting Traffic Expectation
Before starting performance testing, it’s important to determine the expected load, ideally based on actual production traffic. This can be gathered from usage analytics or estimated with input from stakeholders or product owners. The expected load often measured in users per hour can be converted to users per second to define your base load. This base load serves as the starting point for your tests, helping establish a performance baseline before ramping up to peak and stress levels.
As a general guideline, you can calculate the base load using the following formula:
Base Load = Expected Load + 20% buffer
Example:
- Expected Load: 1000 users per hour
- Base Load: 1000 + 20% = 1200 users per hour
To convert this to users per second:
- 1200 users/hour ÷ 60 = 20 users/minute
- 20 users/minute ÷ 60 = ~0.33 users/second
We can take the base load value as (20 users/minute) as a starting point for performance tests.
Defining Test Strategies
Based on application requirements or the established base load, we can derive appropriate performance test strategies such as:
Breakpoint Testing
Formula: Gradually increase load until the system breaks.
Purpose: To determine the maximum load the system can handle before failing.
Key Focus: Identifying the system limit.
Analogy: Like slowly adding passengers and luggage into a car until it can no longer move.
Endurance Testing
Formula: Base load over 8 hours
Purpose: To assess system performance and stability over an extended period of continuous load.
Key Focus: Memory leaks, resource exhaustion, and long-term degradation.
Analogy: Like driving your car with 2 passengers on the highway for an entire day — you’re checking if it remains stable without overheating or slowing down over time.
Stress Testing
Formula: 2 × Base Load for 15 minutes
Purpose: To determine the system’s breaking point by pushing it beyond expected limits and how it recovers back to normal usage.
Key Focus: Failure handling, system resilience, and recovery behaviour.
Analogy: Like overloading a car with 10 passengers and driving uphill. You’re testing how it performs under extreme pressure and how it recovers after it fails.
Load Testing
Formula: 1.5 × Base Load for 30 minutes
Purpose: To validate system behaviour under expected or peak traffic conditions.
Key Focus: Response time, throughput, and error rate.
Analogy: Like testing how well your car drives with 4 passengers on the highway. This is ensuring it performs smoothly under normal or slightly elevated usage.
Defining Success Criteria
One of the most important steps in performance testing is to define success criteria. These benchmarks or thresholds that determine whether the performance test is considered a pass. Establishing clear success criteria ensures the system meets business goals, technical requirements, and user experience expectations under defined load conditions.
Success criteria (general guideline):
- 95% of all response times are at or below 3 seconds.
- 99% of all response times are at or below 5 seconds.
- Error rate must be below 1%
- Average CPU and Memory utilisation rate is below 70%. (subject to scaling policy)
System Architecture Awareness
Understanding your system architecture is equally important, as modern applications often depend on third-party services and cloud infrastructure such as AWS ECS, Lambda, or RDS. Each of these components behaves differently under load and has specific thresholds, such as auto-scaling rules or container resource limits.
For example, application deployed in AWS ECS can monitor CPU and memory utilisation through the ECS service health dashboard. This visibility helps determine whether your system remains operationally healthy under load, and can inform success criteria like average CPU and Memory utilisation rate.

Defining Most Critical User Flow
Before writing any code, it’s essential to design a typical user flow that reflects the most critical business process. This helps you to measure the total time taken for each key scenario and track performance across different stages of interaction. By defining these flows, you can identify performance bottlenecks and ensure the system is optimised for real-world use.
Using an asset management system as an example, a representative user flow might look like this:
- Navigating to a Folder — Accessing a specific folder and waiting for its contents to load
- Performing a Search — Executing a name-based search within the folder
Each step can be instrumented to capture response times, allowing you to pinpoint where performance issues may occur and improve the user experiences.
Folder structure
We can start by creating a dedicated directory named performance under the end-to-end test folder. It should consist of playwright tests (processor.ts), artillery test (artillery-config.yml) and test assets directory which keep the test data.
It may looks like below:
e2e/
├── tests/
|   ├── pages/
|   └── ...
└── performance/
    ├── .playwright-auth
    ├── test_assets/
    ├── artillery-config.yml
    └── processor.ts
Playwright test codes
Below is a sample typescript code snippet that simulates and measures user interactions which can be reused as artillery tests:
- Create test functions by reusing existing Page Object Models (POMs):
- Test setup (authentication, setup test data)
- Test Execution (navigation, performing search actions)
- Test Teardown (cleaning up test data)
- Performs authentication and test data setup once, then persists the session state to avoid repeated logins or data setup during test execution
// processor.ts (Processor file that contain end to end test functions)

import { Page, expect as baseExpect } from '@playwright/test';
import { HomePage } from '../pages/home.page.spec';
import { LandingPage } from '../pages/landing.page.spec';
import { LoginPage } from '../pages/login.page.spec';
import path from 'path'


const folderName = "performance-test-folder";
const authFile = path.join(__dirname, '../.playwright-auth/performance-user.json');
const configuredExpect = baseExpect.configure({
  timeout: 20_000,
});

export async function setupTest(page: Page, context: any) {
  const homePage = new HomePage(page);
  await homePage.goto();

  // Authentication steps.
  const landingPage = new LandingPage(page);
  const loginPage = new LoginPage(page);
  await landingPage.goto();
  await landingPage.gotoLoginPage();
  await loginPage.login(process.env.E2E_LOGIN_EMAIL, process.env.E2E_LOGIN_PASSWORD);
  // Saves authenticated state to authFile for replay
  await page.context().storageState({ path: authFile });

 // Fill up logic to setup test data...
}

// Test execution
export async function testNameSearch(page, vuContext, events, test) {

  const { step } = test;
  const homePage = new HomePage(page);
  const searchQuery = "fileForTestNameSearch";

  // Measures time taken to navigate to a folder inside a library.
   await step('enter_folder', async () => {
     await homePage.goto();
     await homePage.openLibraries();
     await homePage.openMyLibrary();
     await homePage.enterFolder(`${folderName}`);
   });

  // Measures time for executing a name search and asserting the result.
    await step('name_search', async () => {
       await homePage.search(searchQuery);
       await configuredExpect(homePage.SearchResultTabs.getNameMatchTab()).toContainText('Name match');
       await configuredExpect(homePage.SearchResultTabs.getNameMatchTab()).toContainText('1');
      });
    }

export async function tearDownTest(page: Page) {
  const homePage = new HomePage(page);
  await homePage.goto();
  await homePage.openLibraries();
  await homePage.openMyLibrary();
  await homePage.deleteFolder(`${folderName}`);

  // Clean stored auth file
  fs.writeFileSync(authFile, JSON.stringify({}));
}
Artillery test codes
Here is a YAML configuration file that sets up how Artillery will run your performance test using Typescript Playwright test functions.
# artillery-config.yml (Artillery Performance test configuration)

config:
# E2E URL stored in env variable
 target: "{{$env.E2E_URL}}"
 phases:
   # This phase will creates 20 virtual users in 1 minute (60 seconds)
   - duration: '1m'
     arrivalCount: 20
     name: 'warmup'
 processor: "./processor.ts"
 engines:
   playwright:
     defaultTimeout: 20
     trace:
       enabled: true
     contextOptions:
       # Reusing same storage state for all virtual users
       storageState: "performance/.playwright-auth/performance-user.json"
       # Default header might contain "HeadlessChrome" which blocked by firewall
       userAgent: "Mozilla/5.0 (Macintosh; Intel Mac OS X 10_15_7) AppleWebKit/537.36 (KHTML, like Gecko) Chrome/133.0.0.0 Safari/537.36"
     launchOptions:
       # Set to false to debug with visual
       headless: true
       channel: 'chrome'
 ensure:
   thresholds:
     - 'vusers.failed': 0

before:
 engine: playwright
 flowFunction: "setupTest"
scenarios:
 - engine: playwright
   name: NameSearch
   testFunction: "testNameSearch"
after:
 engine: playwright
 flowFunction: "tearDownTest"
Result summary
# Command to run test
artillery run performance/artillery-config.yml
A test run might output results like below:
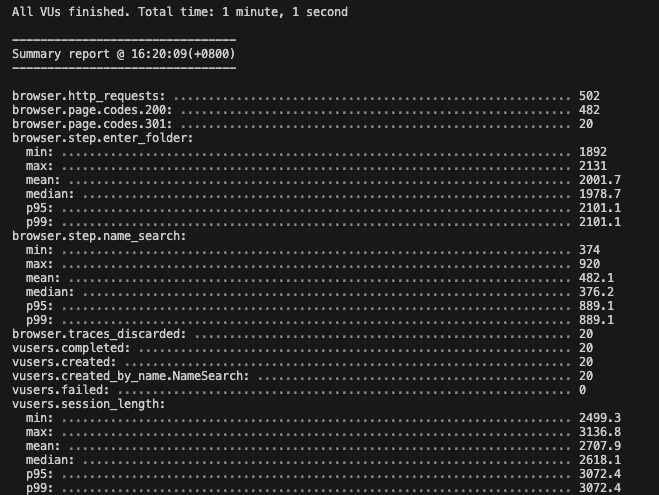
This output offers insights into the application performance, including the number of virtual users simulated, performance metrics for each test step (entering a folder, performing a name search), and the overall session duration per user.
Key metrics:
- All 20 virtual users completed without any errors or failed assertions.
- 95% (P95) and 99% (P99) of user interactions completed within 3 seconds.
Integrating Playwright with Artillery offers a practical and efficient approach to performance testing by leveraging existing Playwright Page Object Models (POMs). This reduces duplication of effort and ensures that performance tests are built on realistic user interactions rather than synthetic API calls alone.

Just as a coffee shop must prepare for rush hours, software development team must do performance tests to ensure:
- The system can handle peak loads.
- Response times remain acceptable under pressure.
- Bottlenecks don’t ruin the “taste” (user experiences)
Without testing at scale, even the most beautiful software application might “taste bad” when real users arrive. So next time you sip your coffee, remember: crafting great user experiences takes practice, precision and preparation just like brewing the perfect cup.
Thanks for reading and let’s continue to learn and share. 🤓
Brewing Quality at Scale: Performance Testing with Playwright and Artillery was originally published in Government Digital Products, Singapore on Medium, where people are continuing the conversation by highlighting and responding to this story.