

5 Ways to Handle Hidden Web Elements in the UI Tree
Debug & Inspect Disabled Elements


Have you ever tried locating a hidden element in the HTML DOM? It can be frustrating, when we have to mouse over a popover or tooltip element in a web app, just to see it disappear the moment we hover out and/or click on the Inspect icon in DevTools.
We encounter a similar issue when we right-click on a dropdown element, when trying to inspect its nested options. The moment we remove focus from the element, its hidden options/subelements disappear from the HTML DOM. This is a common problem with Angular and React apps that use Bootstrap JavaScript features.
The challenge it to inspect a disappearing element and create a WebElement object with Xpath, CSS, or any other locator strategy, so that we can use that object in a test automation script.
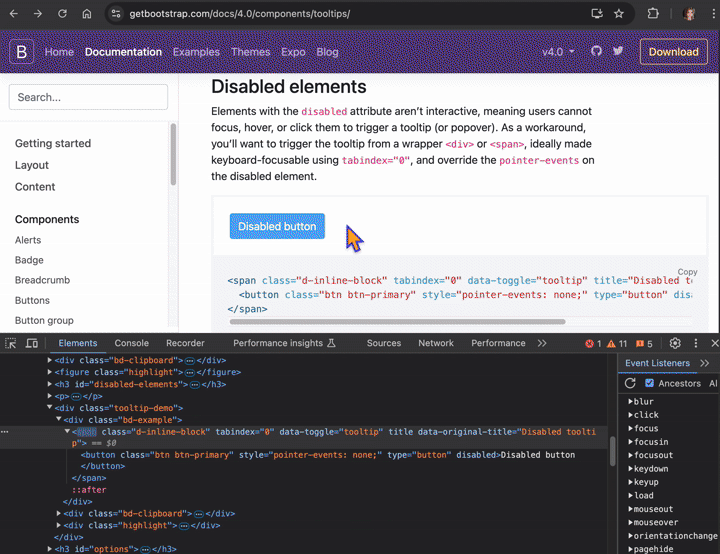
Let’s say we are working with a tooltip that appears upon a click and then disappears. But what if we want to debug this tooltip? For example, right-click on it and change its color? Well, we can’t even focus on it for inspection. So what can we do?
There are several ways to freeze a page that will help us capture hidden elements and display them in the DOM. These approaches can be used with any UI automation tool — Selenium, Playwright, WebDriverIO, Cypress, etc. — because testers locate web elements by using locator strategies that are agnostic of any particular tool or framework. For example, we might use Xpath in a Selenium script or CSS with Cypress. Common locator strategies, like Xpath, are supported by most UI test automation tools.
1. Press 𝐅8 to Freeze Page
Hit F8 on Windows/Linux (or fn + F8 on macOS) to pause the page in the debugger.

This keystroke hack is well-known among web testers. However, it doesn’t always work.
2. Set 𝐃𝐞𝐛𝐮𝐠𝐠𝐞𝐫 𝐓𝐢𝐦𝐞𝐨𝐮𝐭 in Console
If F8 doesn’t work, open Chrome DevTools and run the following JavaScript code in the console. This will break into debugger mode in 5 seconds:
setTimeout(function(){debugger;}, 5000)
3. Remove 𝐛𝐥𝐮𝐫 Event Listener
Another trick is to freeze the page by removing the 𝐛𝐥𝐮𝐫 property under the Event Listeners tab.

With the 𝐛𝐥𝐮𝐫 property now gone, we can hit the Inspect icon and view elements that were previously disappearing.
4. Remove 𝐟𝐨𝐜𝐮𝐬𝐨𝐮𝐭 Event Listener
Some of my QA counterparts experienced confusion, when they could not find the 𝐛𝐥𝐮𝐫 property in their Event Listeners.

For those who cannot find the 𝐛𝐥𝐮𝐫 listeners, alternatively we can delete the ones in the 𝐟𝐨𝐜𝐮𝐬𝐨𝐮𝐭 property.
Note that the deleted properties will re-appear the moment we refresh the page.
5. 𝐄𝐦𝐮𝐥𝐚𝐭𝐞 𝐅𝐨𝐜𝐮𝐬𝐞𝐝 𝐏𝐚𝐠𝐞 in Styles

Chrome has a checkbox called 𝐄𝐦𝐮𝐥𝐚𝐭𝐞 𝐚 𝐟𝐨𝐜𝐮𝐬𝐞𝐝 𝐩𝐚𝐠𝐞. When we click on it, Chrome switches focus from the DevTools to the current page.
Now we can actually inspect it in a much easier way. We no longer need weird hacks to debug disappearing elements on the page.

𝓗𝒶𝓅𝓅𝓎 𝓉𝓮𝓈𝓉𝒾𝓃𝓰 𝒶𝓃𝒹 𝒹𝓮𝒷𝓊𝓰𝓰𝒾𝓃𝓰!
I welcome any comments and contributions to the subject. Connect with me on LinkedIn, X , GitHub, or Insta. Check out my website.
If you find this post useful, please consider buying me a coffee.